Assets
Interactive essays, explorers, and reference material from Chirag Patnaik. 57 of them — search the full text, or filter by subject and browse.
How stories work
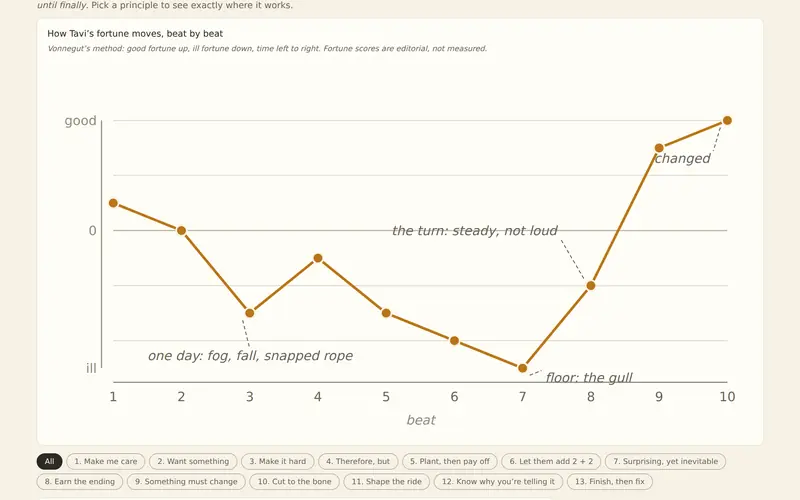
Thirteen storytelling principles that Aristotle, the Natyashastra, Chekhov, Vonnegut and Pixar all arrived at separately — each one drawn, then all of them used in a single short story.
Borrowed time: the Indian household balance sheet
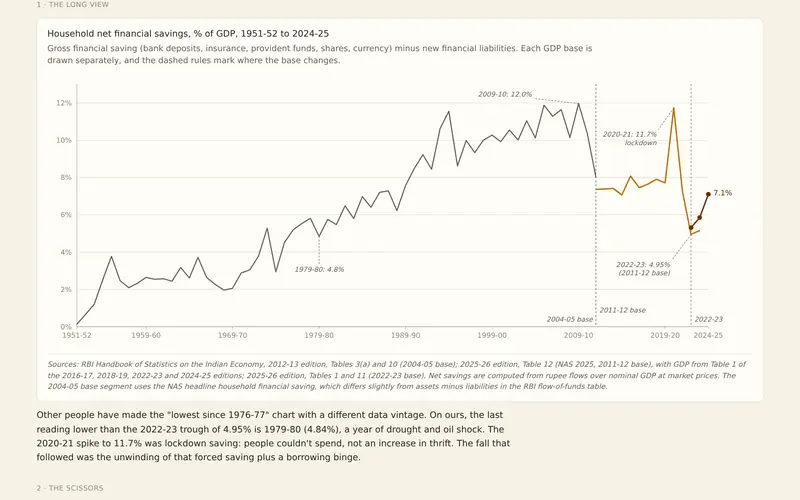
Household savings hit a 45-year low, then recovered — but only because people borrowed less, not because they saved more. Meanwhile the debt kept piling up and the borrowing moved into gold.
What engineering schools teach besides engineering
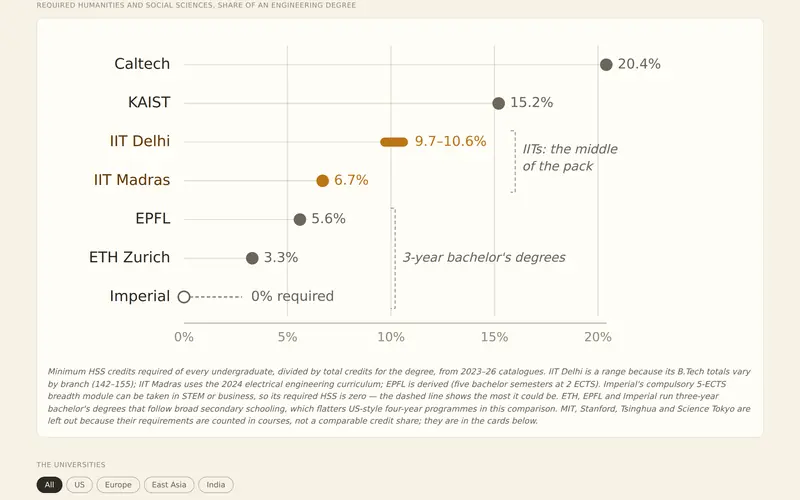
The IITs are being told to close their humanities departments. What fourteen leading engineering schools actually require of their engineers, and what technology leaders have said about it.
Taxing what the rich own
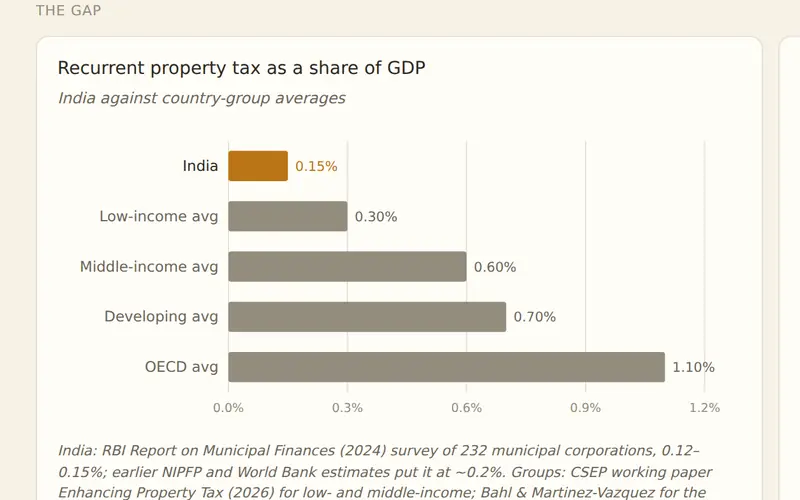
A calculator for two ways to tax wealth in India: an annual tax on property and a levy on financial holdings — how much each raises, what it does to home prices, and who ends up paying.
When Indian wages stopped growing
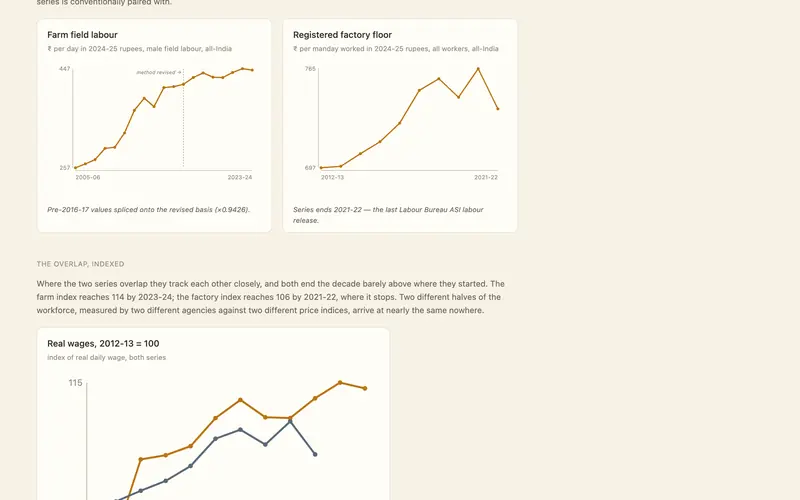
Farm pay rose fast until 2013, then stopped. Factory pay barely moved for a decade. The long view behind the recent numbers.
The only Indian wage that grew
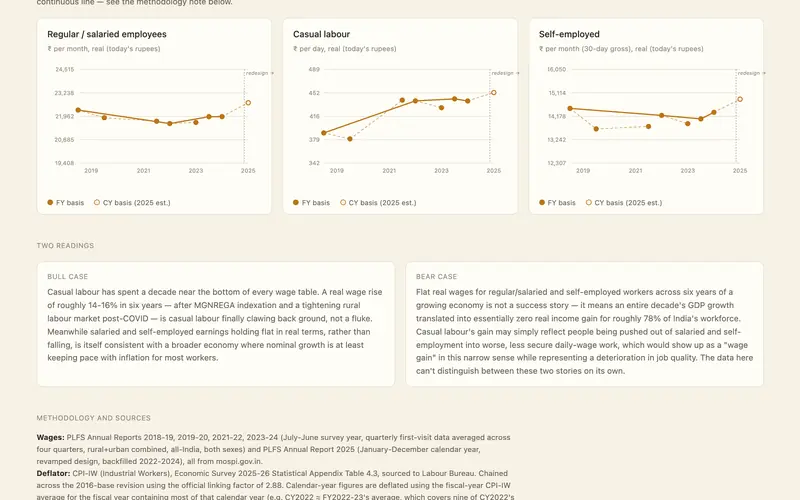
Between 2018 and 2025, only one of India's three kinds of worker saw pay rise faster than prices. It was not the salaried class.
Rich-country debt, poor-country income
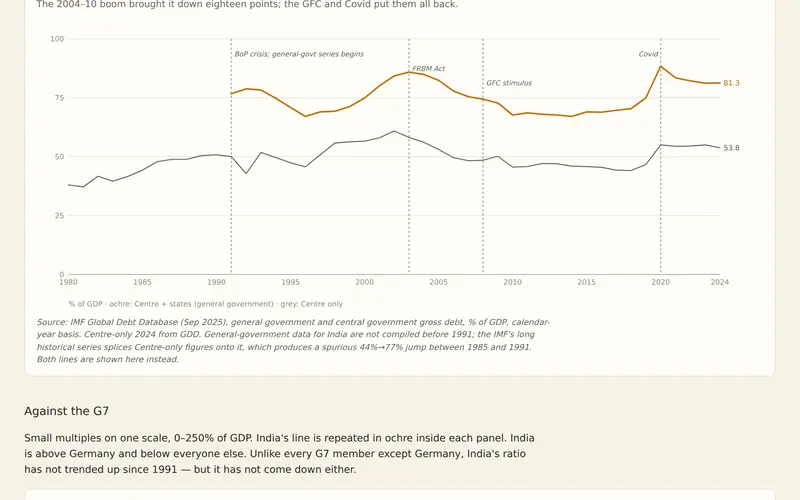
India's government debt since 1980 set against the G7, China, Brazil and countries at its income level — and what it costs to carry.
Household wealth vs. national debt
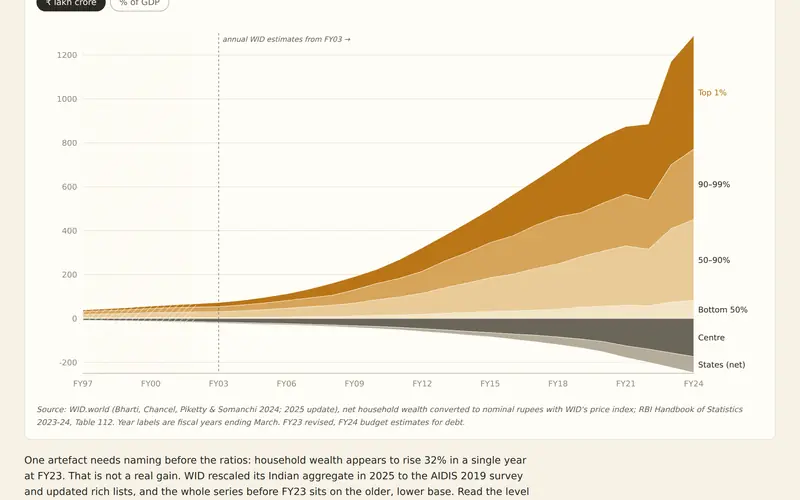
India's household net wealth, split by wealth percentile, stacked against everything the Centre and states owe — FY97 to FY24. The same chart reads as ample fiscal room or as a K-shaped divide, and both cases are laid out.
The break in the series
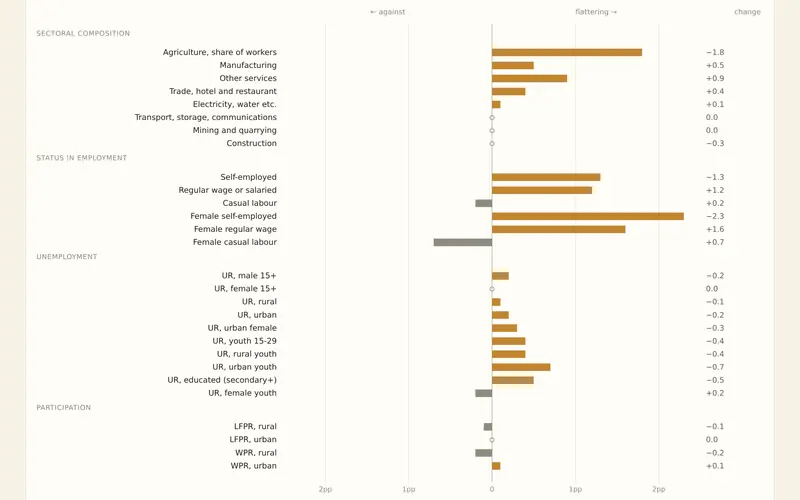
India replaced its main jobs survey in 2025, and nearly every headline labour number moved the government's way in the same year. A look at what a break in the series can and cannot tell you.
The cost of the $136 billion FCNR(B) swap
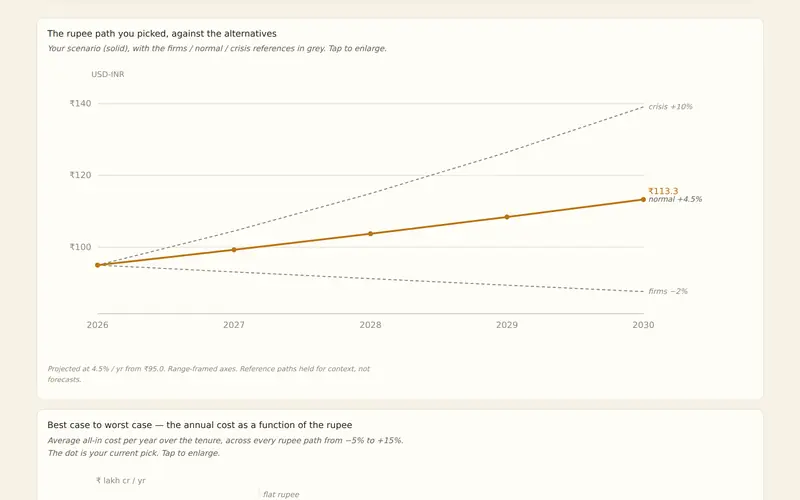
What it costs India to keep the RBI's $136 billion dollar-rupee swap standing — under a rupee that rises, holds, or falls — and how that bill feeds through to inflation. An interactive explorer.
The only economy that matters
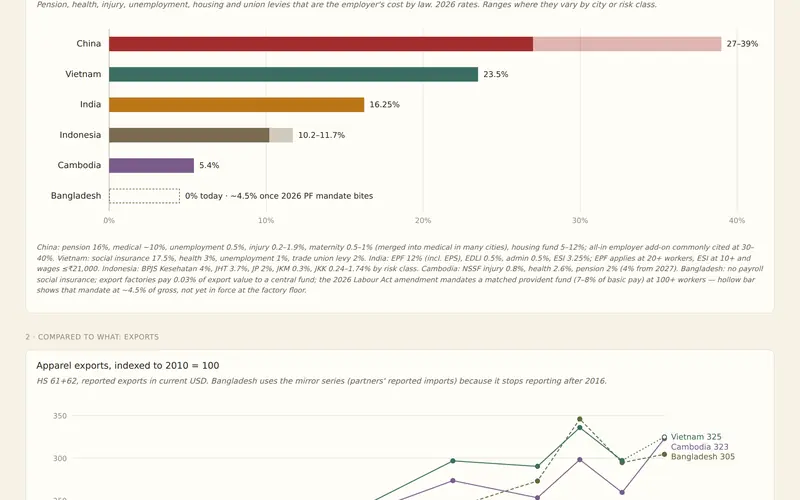
Does protecting garment workers price India out of low-cost manufacturing? Six Asian apparel exporters compared — and the countries winning the export race pay more for their workers, not less.
The delimitation fingerprint
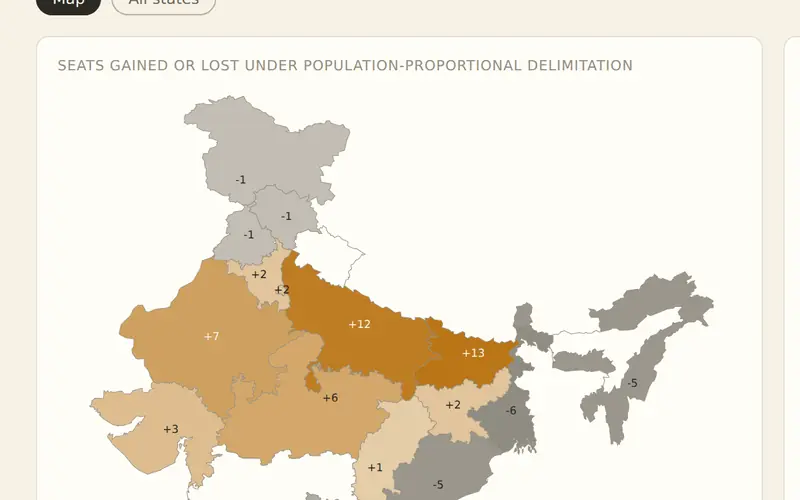
Every Indian state has its own age shape. The states that did most to slow their population growth are the ones now set to lose parliamentary seats for it — each state's demographic profile, and what's at stake when seats are redrawn.
The graduate penalty
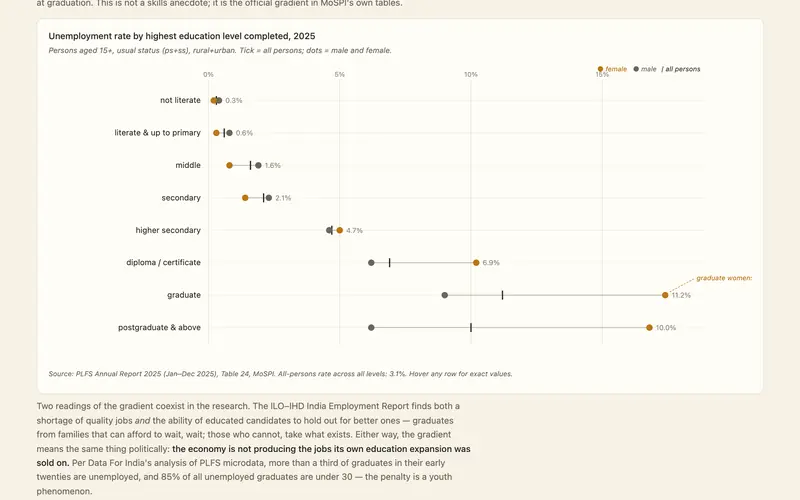
In India, unemployment climbs with every level of education completed — graduates are jobless far more often than the illiterate. A PLFS 2025 explorer of the education gradient, the two ways youth unemployment gets measured, and a sortable state-by-state view.
Stress-testing the Big Cycle
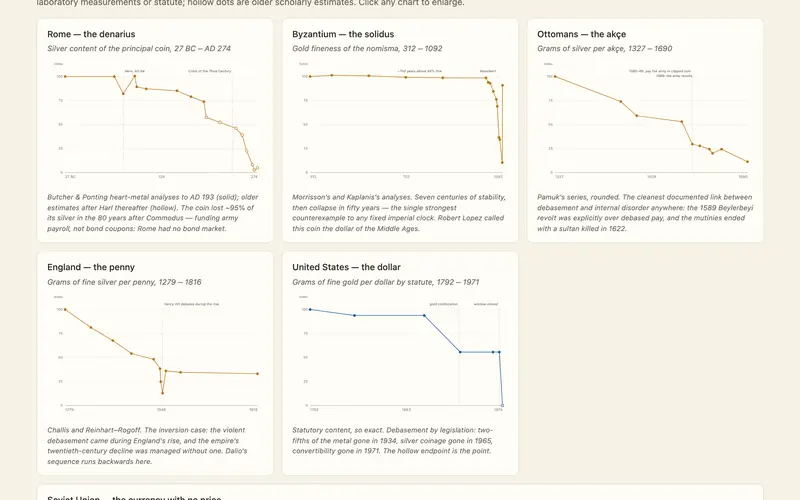
Ray Dalio says empires run on a 250-year clock. This runs his idea against 2,500 years of coinage from eight empires — from Rome to the Soviet Union — and finds the pressures are real but the clock isn't.
Dashboard Pattern Lab
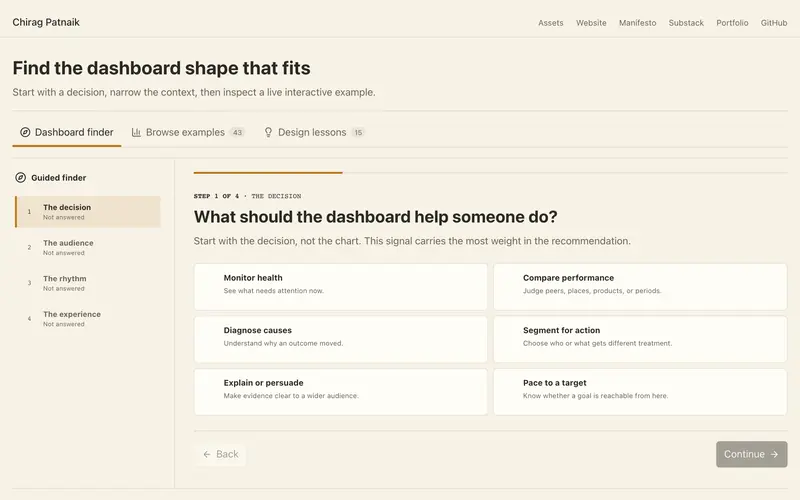
Forty-three dashboard scenarios with live charts, each paired with a short lesson on what makes the design work. Browse how the same ideas show up in scorecards, queues, and forecasts.

The Numbers Game
Nine ways numbers fool you, told through one season at a struggling football club. Every trap is a working model — drag the sliders, press the buttons, and watch the story flip.
A Century Short
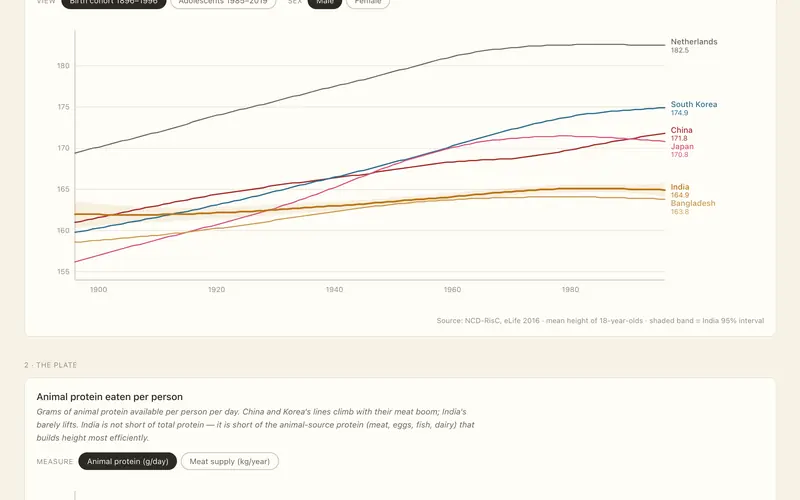
India's young men gained just 3 cm in a century, while Japan and South Korea — once shorter — ended up 6 to 10 cm taller. An interactive look at why India's height stalled, and what taking eggs off children's school plates has to do with it.
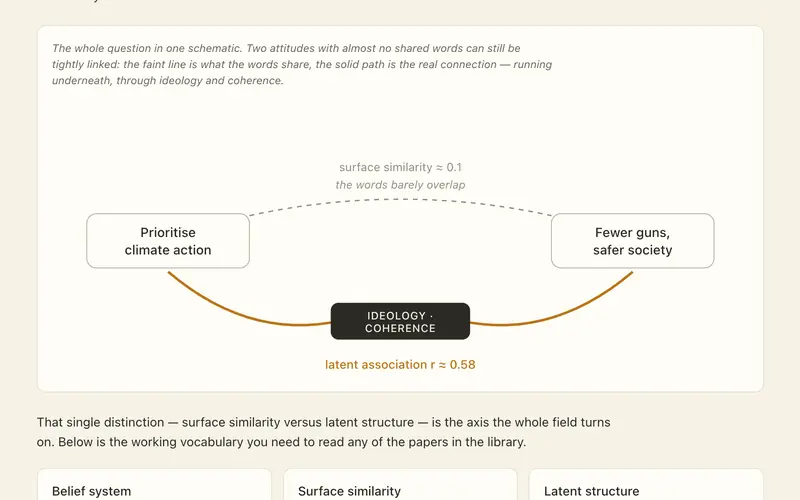
Do language models read the structure of belief?
Can a machine tell what you believe about one subject from your views on a completely unrelated one? A guided map of the research on whether AI reads the hidden structure of human belief — and what that means for persuasion.
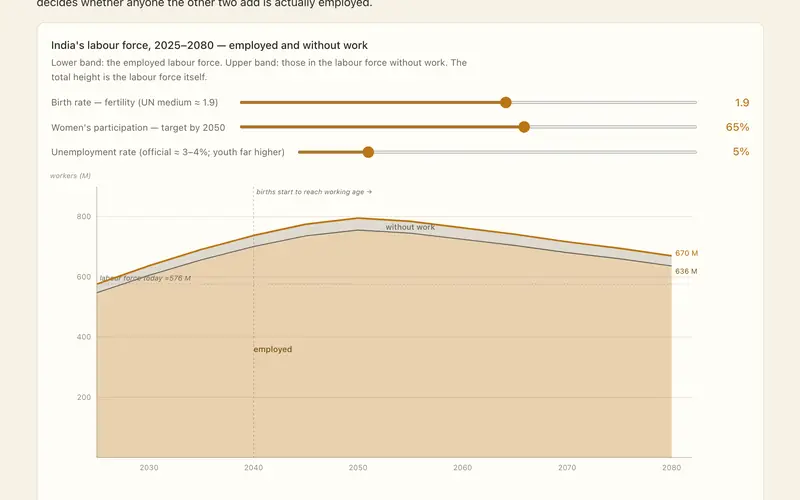
Births, women, jobs: what moves India's workforce
India's workforce has three dials, not one: how many children are born, how many women work, and whether jobs exist. Set each and watch which actually moves the labour force — the birth rate turns out to be the slowest and weakest, and jobs decide everything.
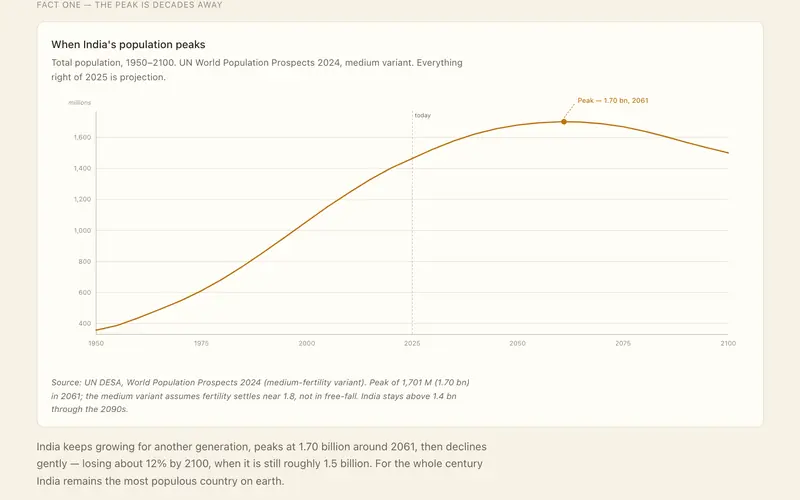
India's population peak — and who pays for the children we have
India's population won't peak until around 2061, at 1.7 billion, and won't drop below a billion until the next century. A look at what that long timeline does to the argument that the country needs bigger families, and who actually pays for the children we have.
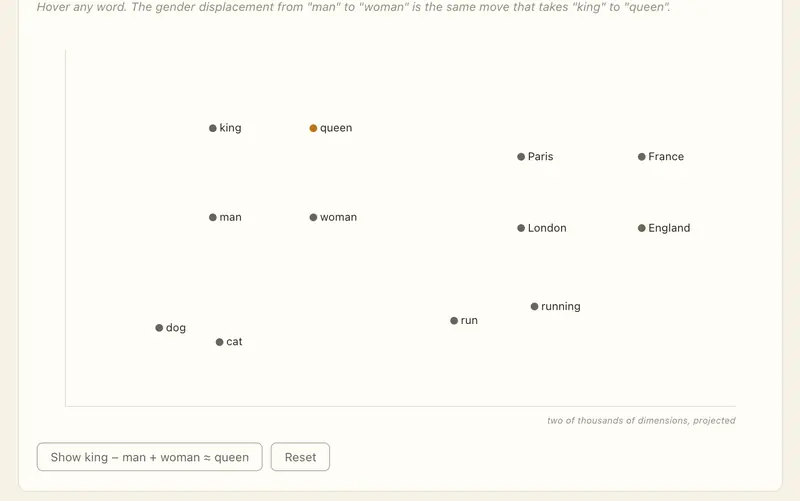
How LLMs actually work
A from-the-ground-up walkthrough of how modern language models work — tokens, embeddings, attention, the feed-forward network, and the next-token loop — each stage rebuilt as something you can step through and poke at.
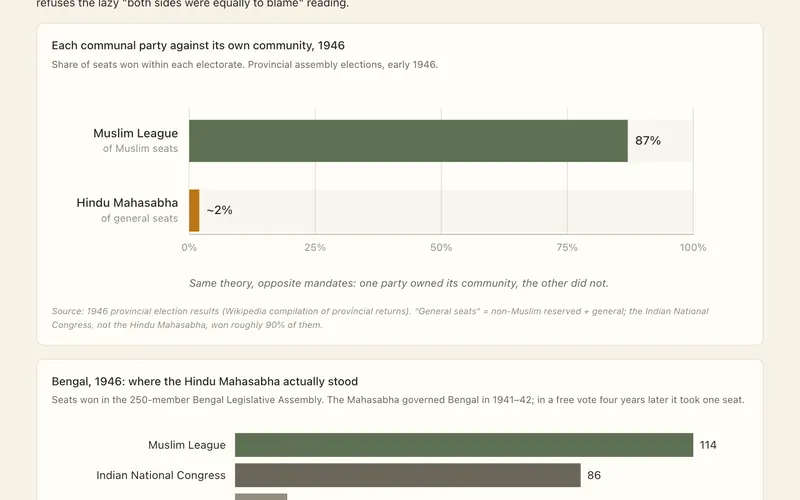
The road to Partition: two two-nation theories
The two-nation theory was not a Muslim League monopoly. The Hindu Mahasabha built the Hindu version — and the two organisations mirrored, and at times governed alongside, each other.
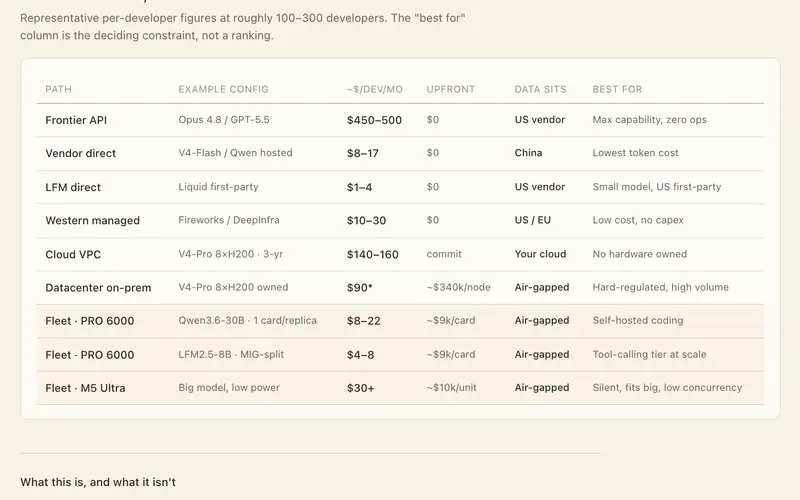
Sovereign AI — where does it run?
Costing the sovereign-AI decision: API vs cloud vs on-prem vs fleet, across DeepSeek, Qwen and Liquid models, priced per developer.
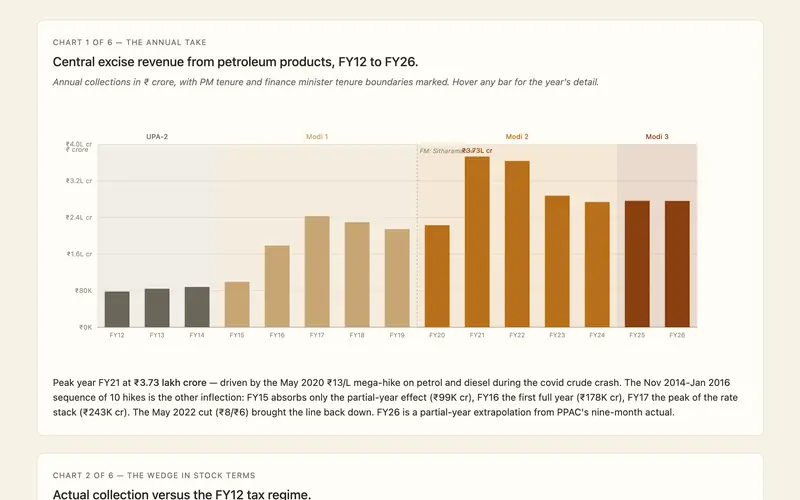
The oil windfall: twelve years, ₹21.8 lakh crore
Cumulative central excise extracted above the FY12 tax regime, FY12-FY26. Twelve years, two finance ministers, one through-line.
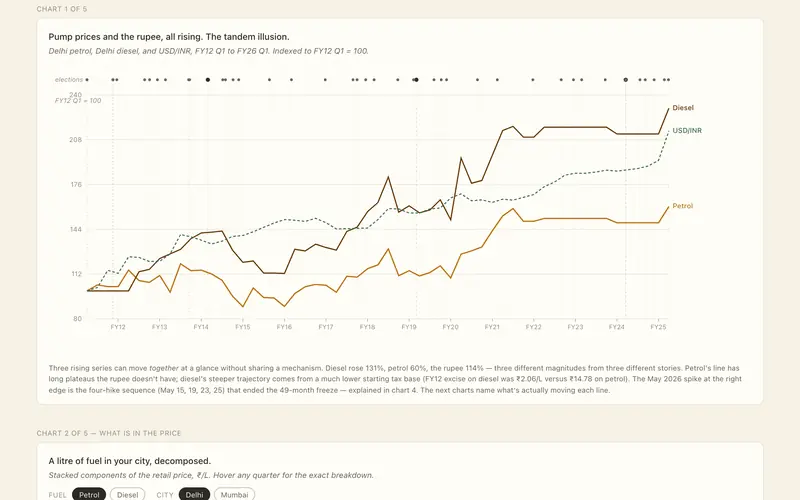
Petrol and the rupee: not the story you think
The pump price doesn't track the rupee. It tracks tax policy. Fifteen years of data, decomposed.
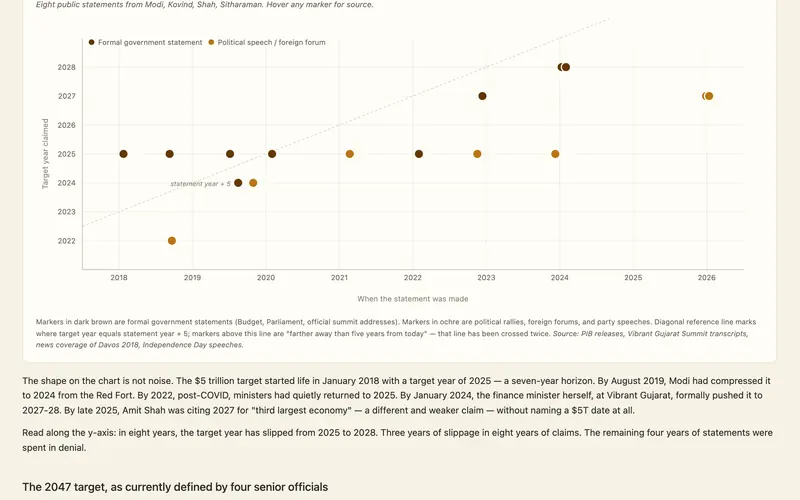
2047 arithmetic
The 2047 target has receded every year. The regime no longer agrees with itself on the number. A look at the math behind the slogan and the lifecycle of the rhetoric.
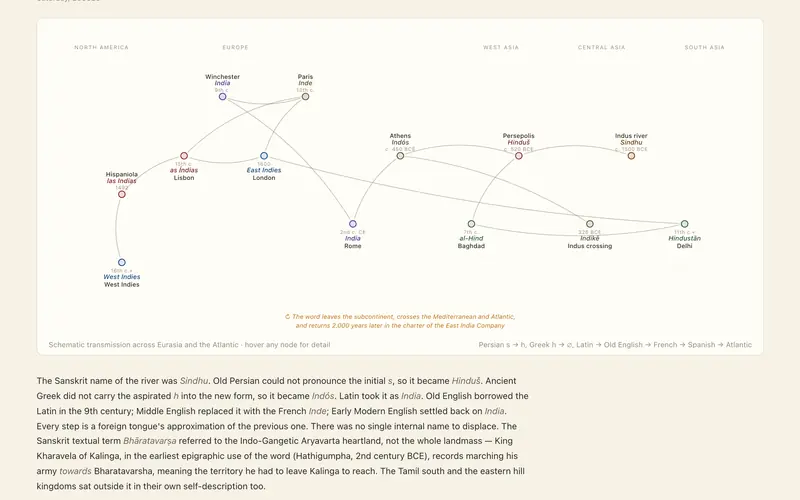
The name of India
How Sindhu became Hinduš became Indós became India, and how the same word, once misused by a lost Genoese, came to label the indigenous peoples of two continents.
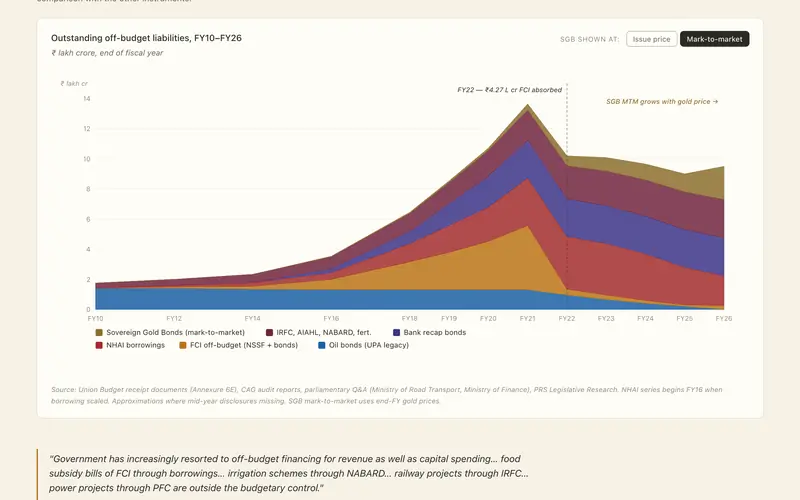
Off the books — India's hidden fiscal stack, 2002–2026
Twenty-four years of off-budget borrowing, by instrument and government. Vajpayee's ₹9,000 cr oil pool bonds to the Modi-era ₹13 lakh cr stack across FCI-NSSF, NHAI, IRFC, bank recap, AIAHL.
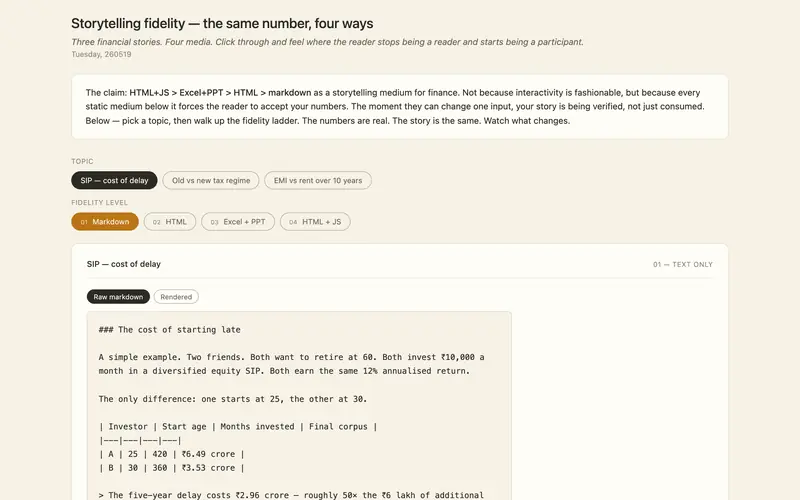
Storytelling fidelity — the same number, four ways
The same financial story told as markdown, static HTML, Excel+PPT, and interactive HTML+JS. The reader feels the gap.
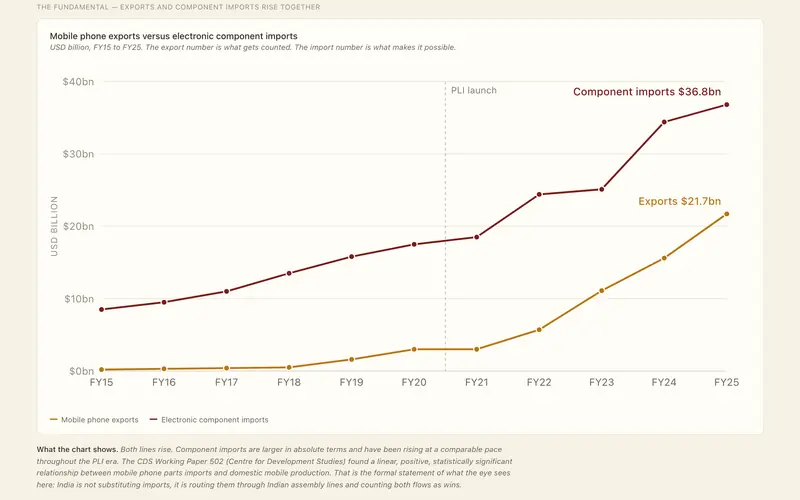
The vanity metric
India's biggest export category — mobile phones — is a pass-through. Components imported, phones exported, citizens taxed at 18% to fund the photograph.
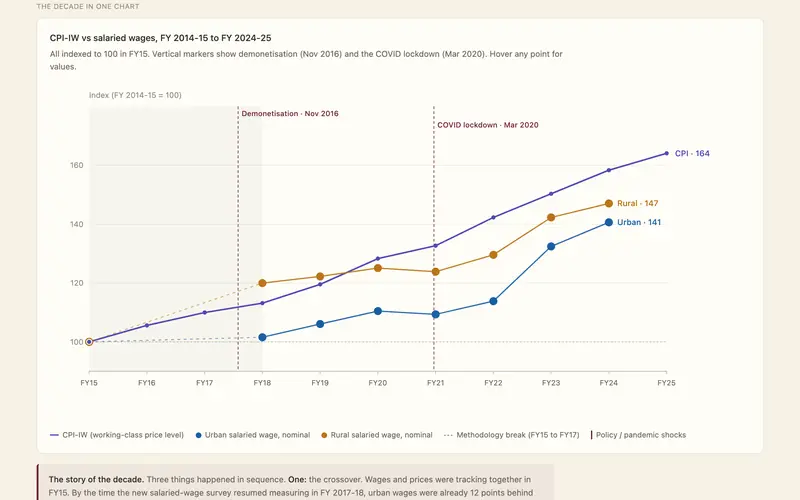
The salaried Indian got poorer
A decade of working-class prices alongside salaried wages. Prices rose 64%, wages did not keep up. The crossover happened around demonetisation, the bottom was COVID, the salaried class has not recovered.
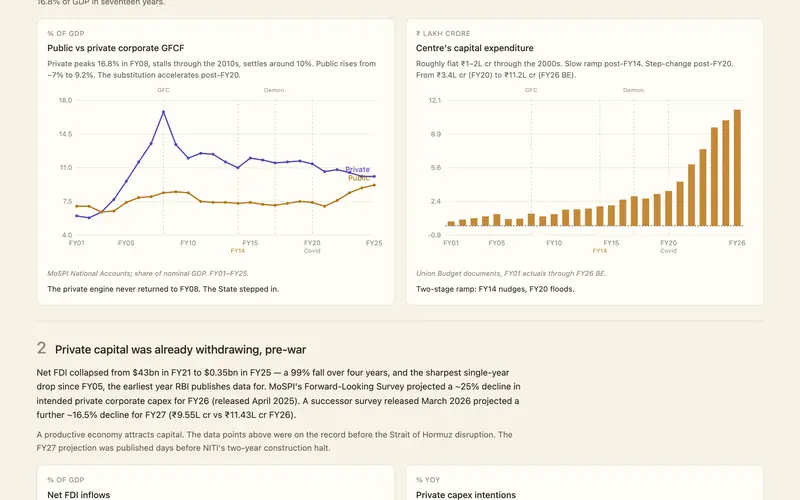
Contractor Raj
A forensic look at India's contractor-led growth model: how the State became the dominant customer for capex, how it was paid for, and what was already visible in the data before the West Asia crisis.
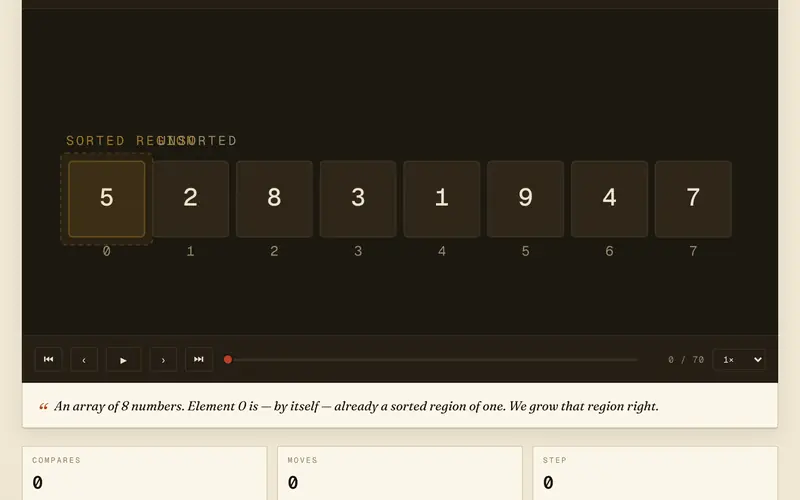
Workings — algorithms in motion
Companion to The Algorithm Atlas. Forty-seven specimens animated step by step — code on the left, structure on the right, controls below.
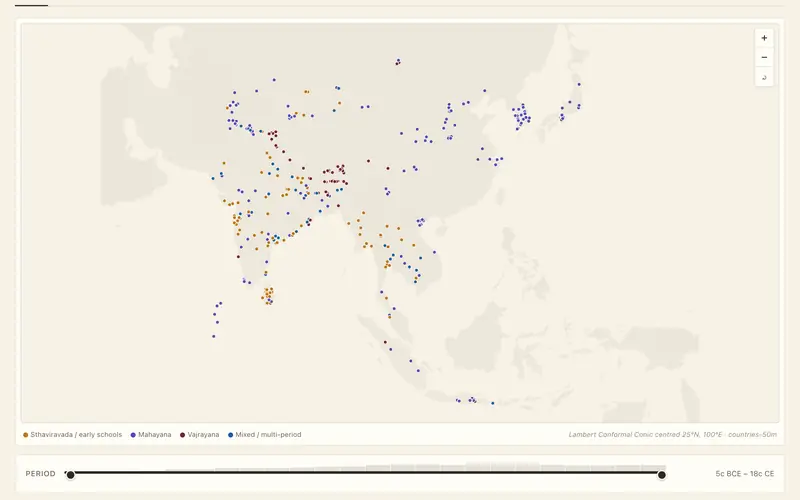
The Buddhist world, 5c BCE – 18c CE
From Bamiyan to Bagan, Borobudur to Bulguksa — 500 ancient Buddhist sites mapped across Asia, with the patron dynasties that built them.
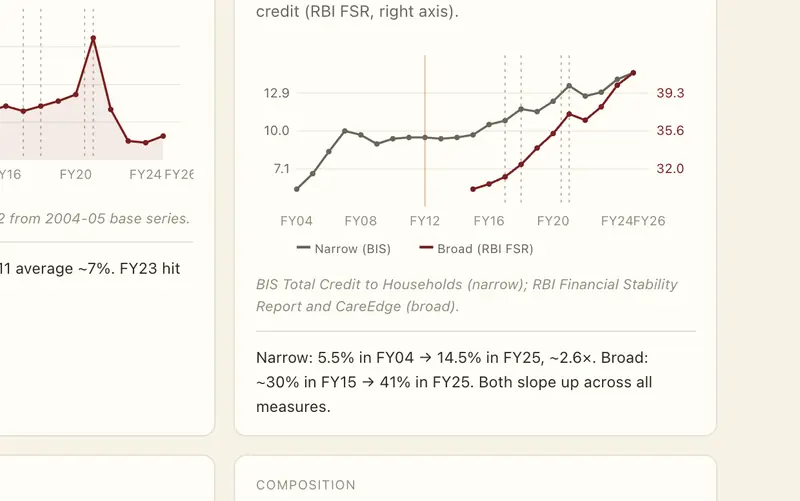
Strip the props
Twenty-two years of headline Indian GDP versus the underlying fundamentals, plus how the public capex was paid for. Twelve charts, one closed loop.
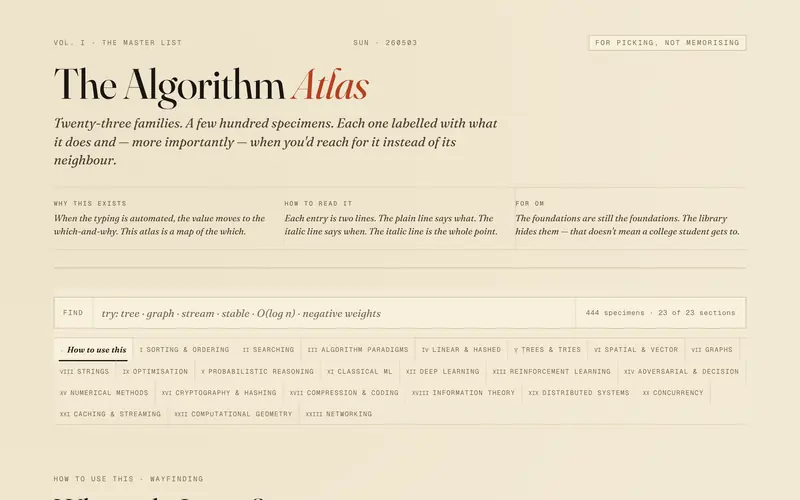
The Algorithm Atlas
Twenty-three families of algorithms, four hundred and forty-four specimens. Each labelled with what it does and, more importantly, when you'd reach for it instead of its neighbour.
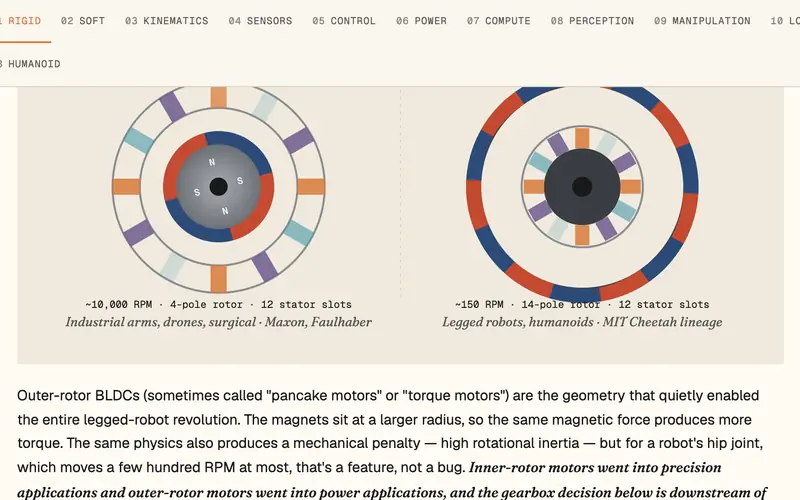
Robotics — A Field Guide
Thirteen layers of metal, signal, and silicon. From the actuator to the humanoid moment — every layer of the modern robot, animated.
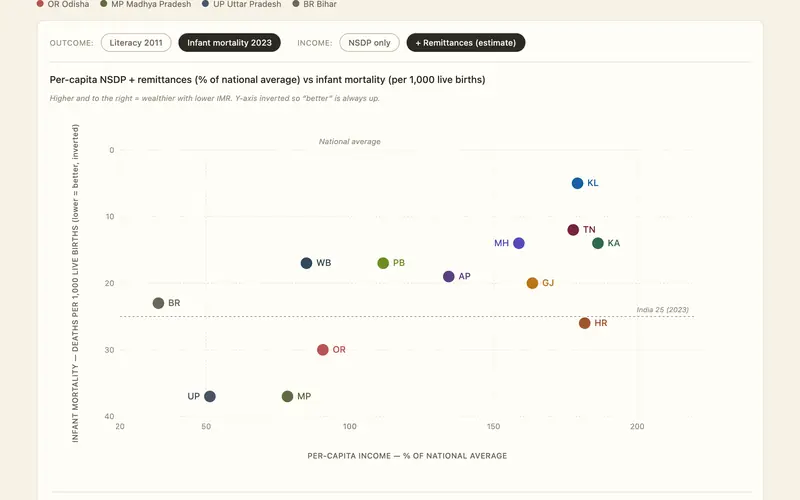
Income vs outcomes — thirteen states on one canvas
Per-capita income against literacy and child survival across thirteen Indian states, with a toggle to add overseas remittances back in. Two states sit clearly off-trend.

The Semiconductor Field Guide
From transistor to package — twelve layers of the chip industry, animated. Architectures, lithography, memory, power, geopolitics, and where most chips actually live.
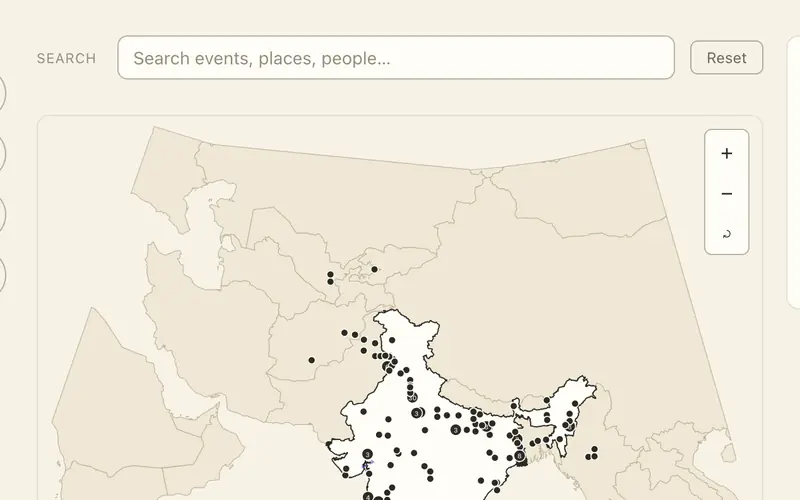
India — 2500 years to the Republic
An interactive atlas of subcontinental history — 203 events from 518 BCE to 1992 CE pinned on a map, walked by threads, traced through 32 lives, and gathered into 14 thematic collections.
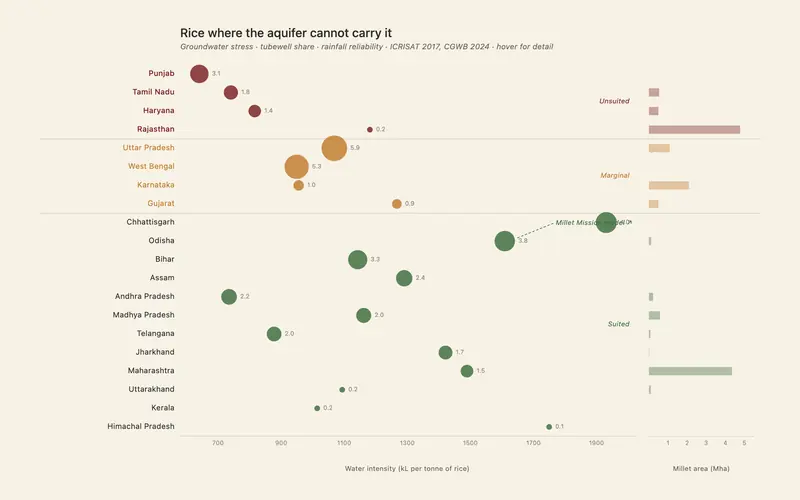
India grain policy, state by state
Rice and millet area, procurement, groundwater stress, and crop-switching potential across 20 states — district-level data, interactive explorer.
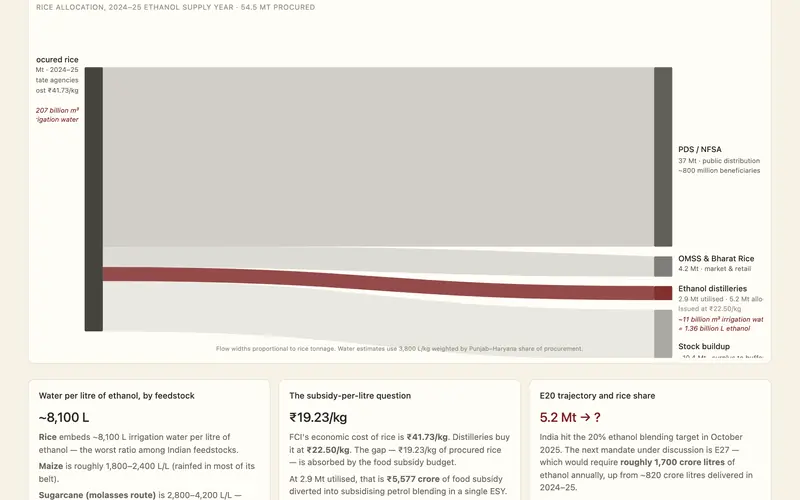
Rice to ethanol: the groundwater flow
Where India's 54.5 Mt of procured rice went in 2024–25 — and how much irrigation water the ethanol allocation exports as motor fuel.
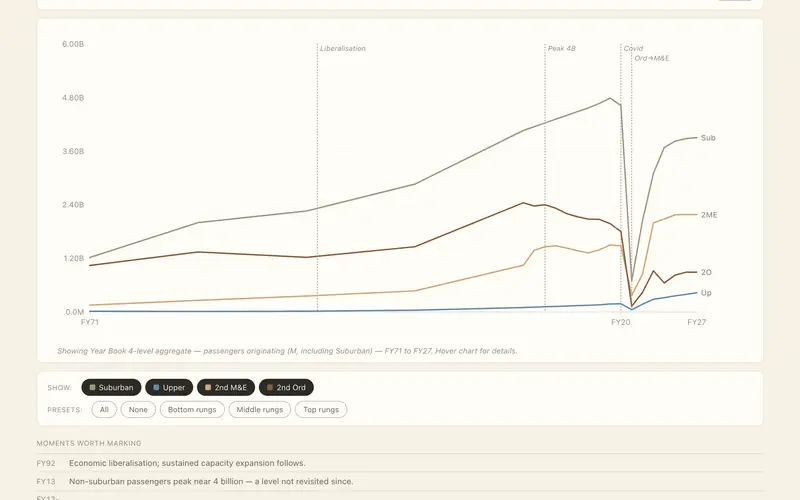
The Indian Rail Travel Ladder — 1971 to 2027
Fifty years of Railways passenger data as a proxy for income distribution — 10 classes, three granularity layers, sliding window zoom.
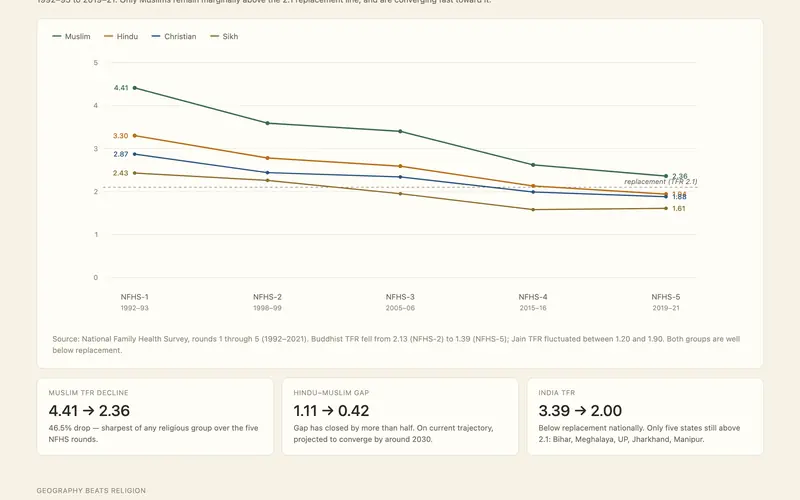
The demographic change story is misplaced
Fertility has collapsed across every religion in India. The Hindu–Muslim gap has more than halved — geography now explains fertility far better than religion does.
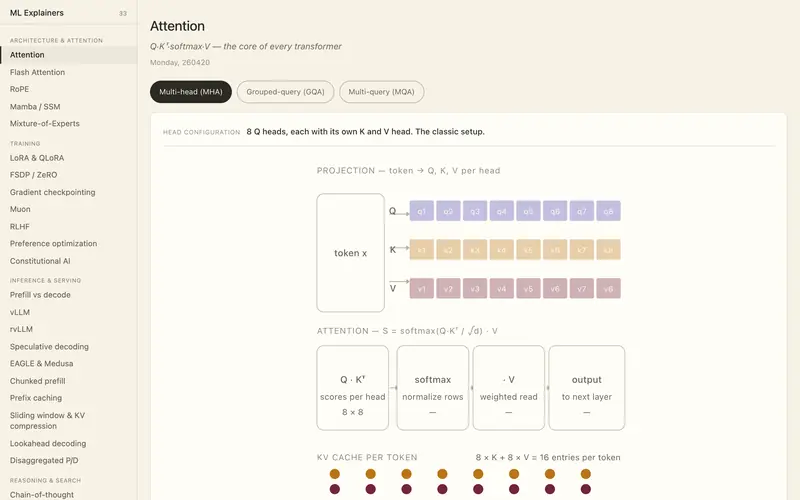
ML Explainers
33 interactive explainers across architecture, training, inference, and reasoning — attention, LoRA, vLLM, speculative decoding, RLHF, and more.
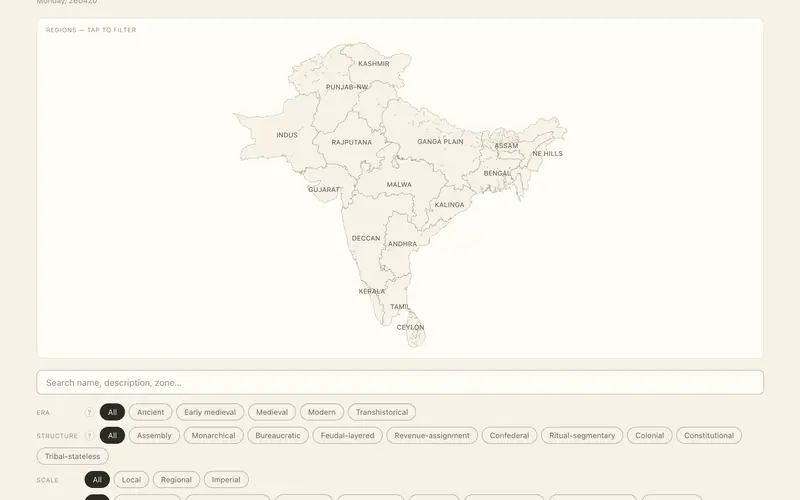
Systems of the Subcontinent
Thirty-five governance systems of the Indian subcontinent, from gana-sangha republics to constitutional federalism — searchable and filterable.
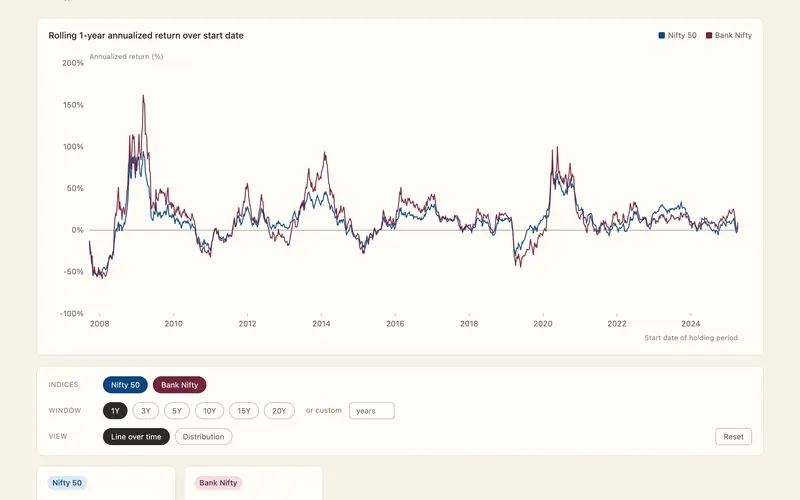
Rolling Returns Explorer
What you'd have actually earned holding Nifty 50 or Bank Nifty for 1, 3, 5, 10 years — starting on any day since 2007.
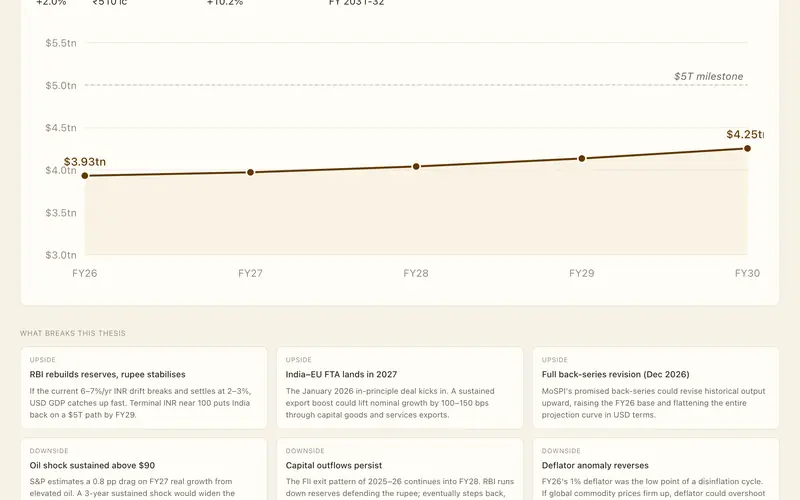
India 2030 — The Standstill Scenarios
If the rupee drifts to 120 and real growth holds at 6%, where does India's USD GDP land by FY30? An interactive scenario modeler.
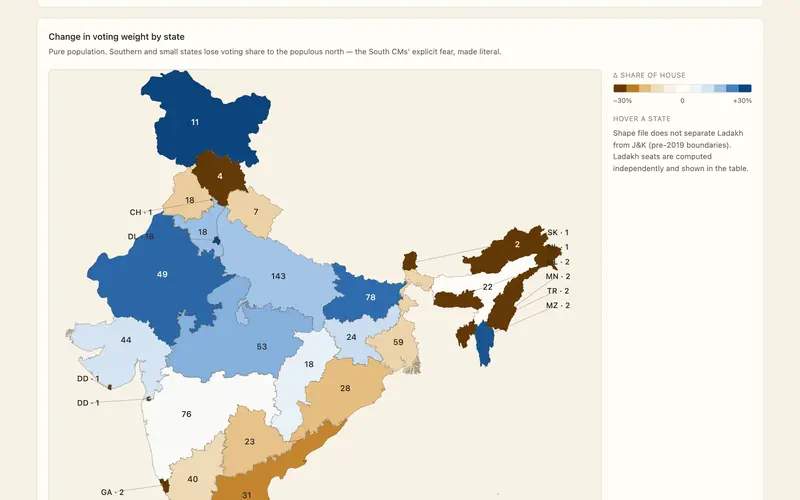
Lok Sabha Delimitation Explorer
Five formulas for distributing an expanded 850-seat Lok Sabha across India's states — whose vote gets heavier, whose gets lighter.
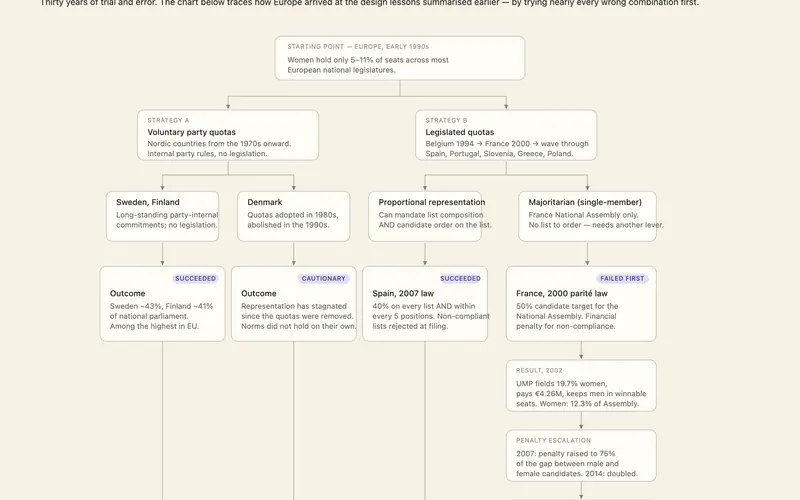
Women in the Legislature, by Ticket Not by Seat
India's reservation debate, the European evidence, and the design tensions that won't go away.
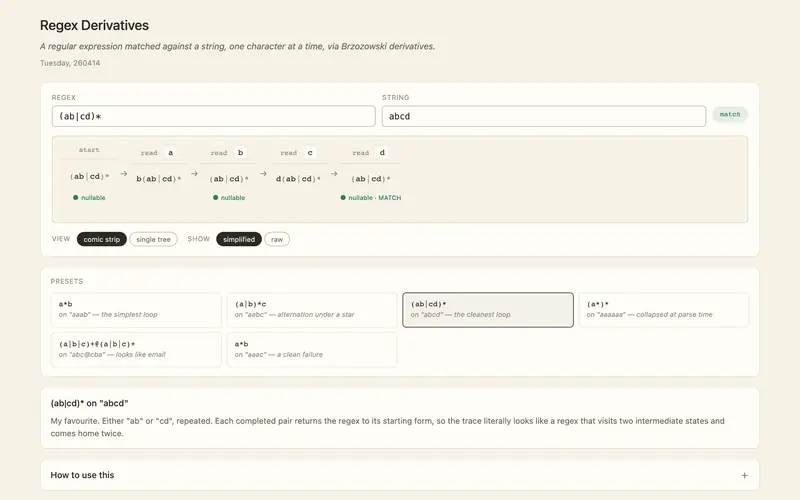
Regex Derivatives
Watch a regular expression match a string, one character at a time, via Brzozowski derivatives.
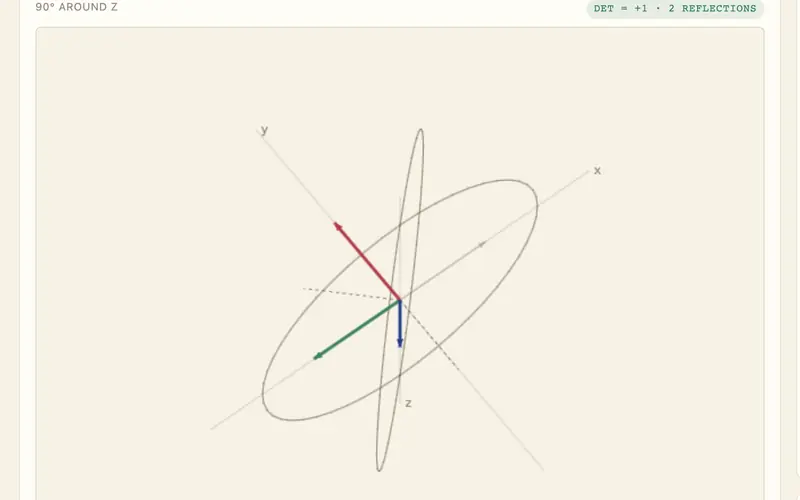
Reflections
Every 3D rotation is the composition of at most three reflections. Pick one, watch it factor.
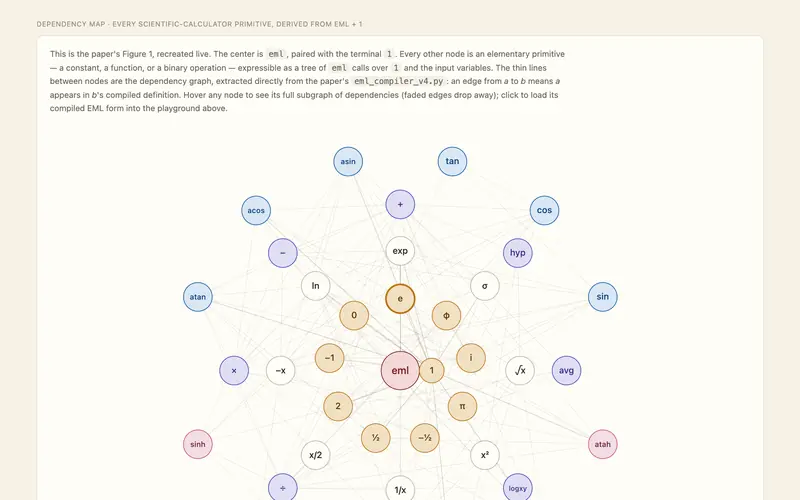
EML Explorer
One binary operator, one constant, and every elementary function falls out — an interactive look at the eml operator.
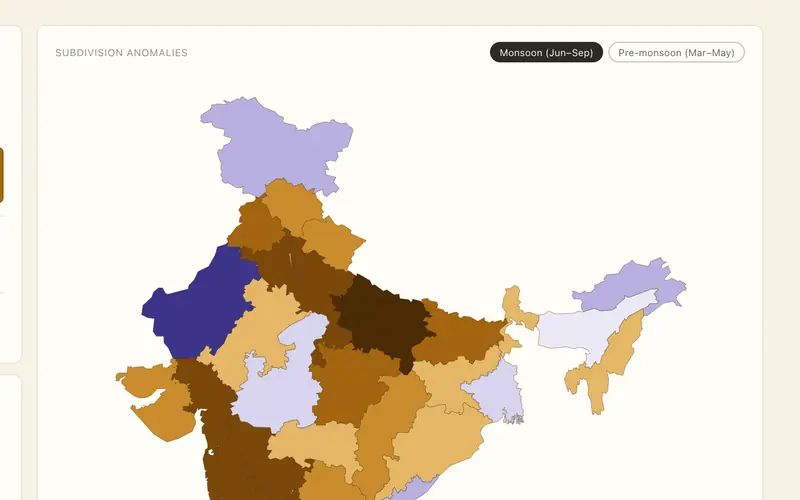
India's Monsoon, Year by Year
126 years of summer monsoon performance by meteorological subdivision — the all-India number is a fig leaf; the variance is the story.
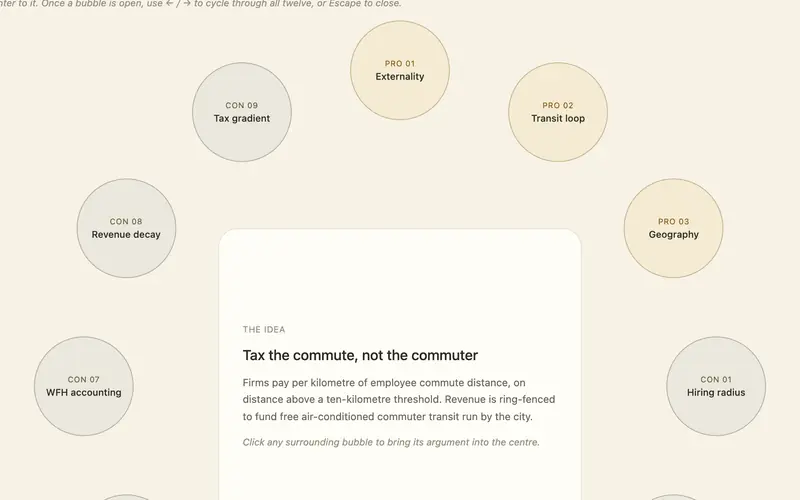
Tax the Commute, Not the Commuter
A proposal to tax companies per the distance their employees commute — the arguments for, the objections against, and the mechanism.
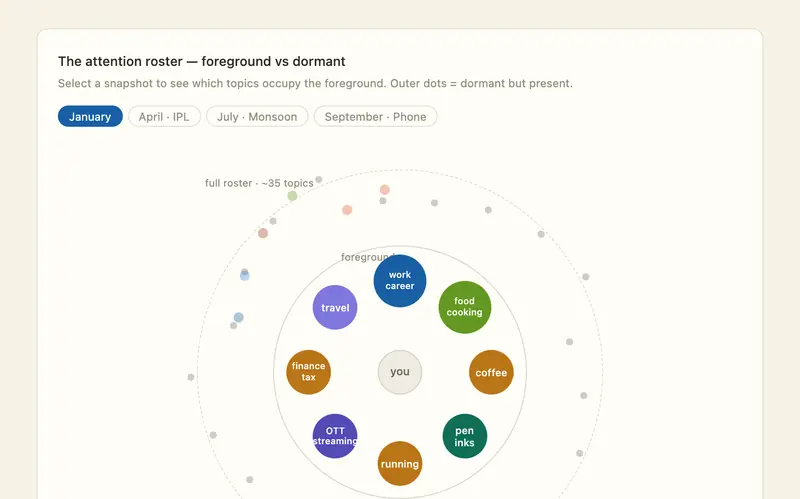
A Model of Human Attention
How attention works as a fixed budget — categories competing for a share, brand cycling within categories, and what converts attention into purchase intent.
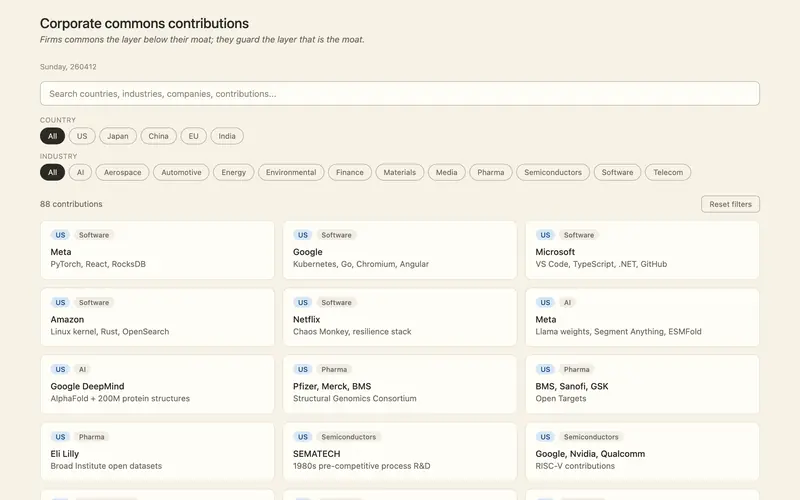
Corporate Commons Contributions Explorer
How corporations across the US, Japan, China, EU, and India contribute to the global commons — filterable by country and industry.
Nothing in that subject yet.